


%20-%20Scale%20Measuring%20Company%20Logos%20-%20PNG%20-%202-25-2020.png?width=1600&name=Image%20-%20Blog%20Image%20-%20Kevin%20-%20Why%20The%20S%26P%20500%20Isnt%20What%20You%20Think%20It%20Is%20(Updated)%20-%20Scale%20Measuring%20Company%20Logos%20-%20PNG%20-%202-25-2020.png)
Summary:
|
The S&P 500 index is a stock market index that seeks to track the stocks of 500 large U.S. companies. It represents the stock market's performance by tracking and reporting the rate-of-return from some of the largest companies in America. Investors often use it as a benchmark for the overall stock market, to which many other investments are compared. Over the last 10 years, the index has posted an annualized return of 9.8 percent, and over the last 20 years, 6.3 percent.
The S&P 500 index is capitalization-weighted. A single company’s market capitalization (or “value”) is calculated by multiplying the number of shares outstanding by the current stock price. In other words, a company that has a market cap of $100 billion receives 10 times the representation in the index as a company whose market cap is $10 billion.
Pulse Required
Although referred to as a large-cap index, the S&P 500 doesn’t just consist of the largest companies in the U.S. The companies in the index are chosen by real human beings who have the power to make changes to the index on an annual basis. While there are guidelines for which companies are added or subtracted, the final decision essentially depends on what's going through the heads of a handful of people who make up the Index Committee at Standard & Poors.
Size Matters
Because the companies chosen for the index tend to be leaders in their industries, most are large firms. But the largest of the large-cap stocks have a much greater influence over the S&P 500 than the smaller companies. At this writing, half of the total market cap of the 500-stock index comes from just 50 of its constituents.
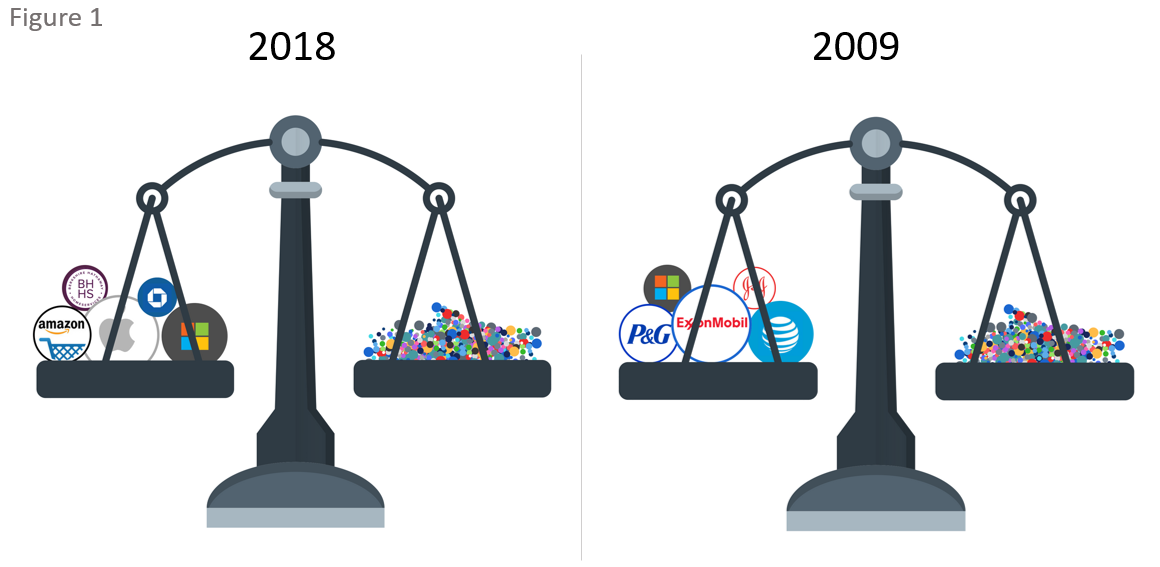
Zooming in, we discover that the top 5 companies in the S&P 500 (Apple, Microsoft, Amazon, Berkshire Hathaway, JPMorgan) account for more than 14 percent of the index, and the top 10 companies account for nearly 22 percent of the index. Measured another way, the total weight of the top 5 is equal to the total weight of the bottom 265 (Figure 1) and the top 10 more than the bottom 333 companies! For every $100 you invest in the S&P 500, $22 buys the 10 biggest companies, $22 scoops up the bottom 333, and the remaining $56 used to acquire the “middle” 157.
While many investors believe that owning the S&P 500 index ensures that they have sufficient diversification and broad exposure to the U.S. economy, this is simply not the case. And wasn’t true 10 years ago either.
Change Is Constant
Although the S&P 500 overseers stated belief is "turnover in index membership should be avoided when possible”, the historical turnover rate is 4.4 percent annually, or approximately 22 changes each year. Viewed another way, more than half of the companies in today’s S&P 500 index were not in the index 20 years ago…a measure of time longer than the career of most of today’s investment professionals.
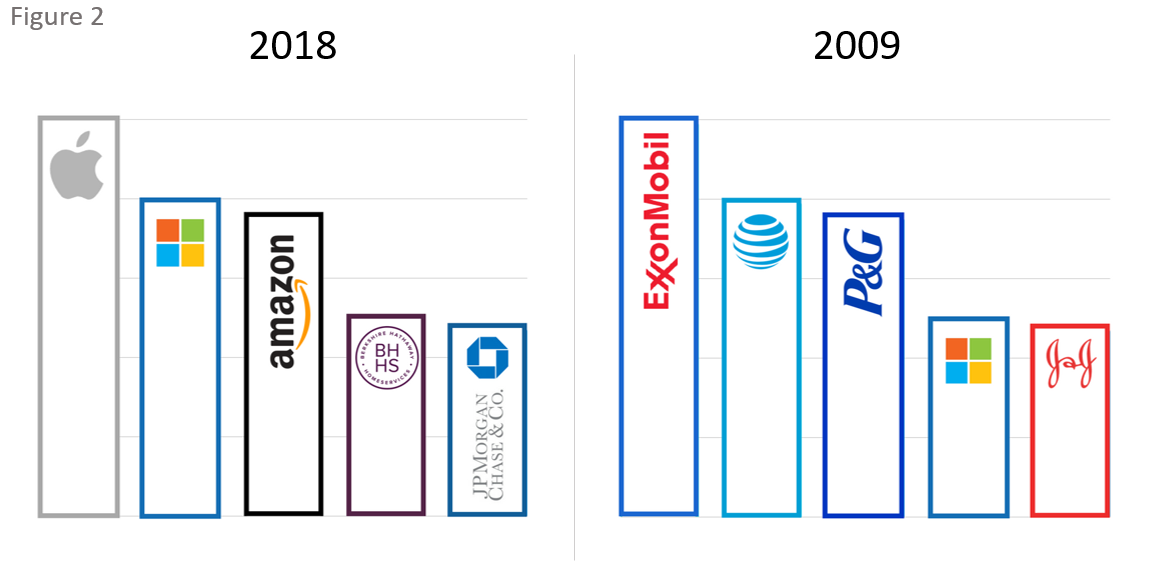
By comparing the “top 5” index members of today versus the behemoths of 2009 (Figure 2) we are reminded that economic cycles ebb and flow, secular trends rise and fall, new companies are built while former “blue chips” struggle, and for every Enron, Lehman Brothers, GM or GE that busts, there’s an Apple or Amazon shooting up through the ranks.
How might this game of musical chairs impact the performance of my portfolio? Quite dramatically.
According to Ned Davis Research, for the 41-year period from 1972 to 2013, the S&P 500 advanced nearly 5,000 percent, but if you had owned just the single biggest stock in the index every year you would have gained around 400 percent. So, while it feels like today’s top 5 companies can do no wrong, history says not all of them will remain at the top in the decades to come.
Know What You Own. Or Better: Own What You Know
Close examination of the weightings of the companies that comprise in the S&P 500 stock index quickly disabuses us from the notion that the index is a diversified basket of 500 companies. While that's technically true in form, it is not true in substance.
I am not arguing that this is either good or bad. In fact, many people would consider today's top leaders to be good, if not great, companies. But, great companies do not necessarily make for great stocks and history tells us that the biggest gains will come while on the journey to the top spot, as opposed to after arriving there.
My advice? Do your research. Or hire an independent Registered Investment Advisor (RIA) to do it for you. And go find tomorrow’s next big winner.

Kevin McVeigh, CFA is a Managing Director and Partner at Exchange Capital Management, a fee-only, fiduciary financial planning firm. The opinions expressed in this article are his own.