When the Music Stops (and it will), Will You Be Left Without a Chair? Take This Quiz to Find Out.
What was the most valuable company in the world 15 years ago?
Apple, right? Wrong.
Microsoft? Nope.
The most valuable company in the world 15 years ago was General Electric. Rate-of-return for investors in GE since 2005? Minus 69 percent.
What was the most valuable company in the world 10 years ago?
It must be Apple! Wrong, again.
Microsoft? Nah.
The most valuable company in the world 10 years ago was ExxonMobil. Rate of return for investors in XOM since 2010? Minus 3 percent.
How about 5 years ago?
Apple? (please be right, please be right…) Correct!
And at the time of this writing AAPL remains the most valuable company in the world with a market capitalization of $2 trillion.
Rarefied Air
Over the past 5 years, Apple’s split-adjusted share price has risen from $27 to $118, its market capitalization from $600 billion to $2 trillion, and its per-share profits from $2.17 to $3.30. For shareholders, this translates to a stunning (and rare) annualized rate-of-return of 34 percent! Impressive. Wait, what? Stop! Let’s back up and do some simple math. Could it be true that AAPL’s share price has risen more than 330% while the profits standing in support of this huge increase have risen only 52%? It’s true. And cause for concern.
This disconnect between AAPL’s price-per-share and profit-per-share is expressed more clearly by looking at one fundamental metric of value: Price/Earnings ratio or P/E. Simply stated, the P/E of a company is a measure of how many dollars an investor is willing to pay for the right to claim ownership of one dollar of future profit. Naturally, we’d all like to pay as little as possible for each dollar of profit, making the P/E of a stock an important tool to help ascertain the attractiveness of an investment. Five years ago, the P/E of AAPL was 13. Today, it’s 35. Moreover, the P/E of AAPL was 19 at the start of this year alone, well below today’s lofty level. The takeaway? It’s reasonable to suggest that the air around AAPL’s share price is thinning and caution is warranted.
But the larger question is the next question: Who will be the most valuable company in the world in 2025? Will it still be Apple? How about Microsoft? Amazon, maybe? Or will it be some other company that’s not currently at (or near) the top of the heap but is quietly and carefully putting all the pieces in place to make a run at displacing one, or all, of the big guys? Impossible to say, of course, but a research paper titled The Winners Curse: Too Big to Succeed? should serve as an invitation to Apple shareholders to at least consider the advice of Apple itself and Think Different.
Tiger's Tail
Earlier this month, the S&P 500 stock index set a record high, closing 10 percent above its January 1 start and, today, after a post-Labor Day pullback, rests (albeit, uncomfortably) roughly 6 percent higher for the year. As impressive as this outcome seems in this pandemic year, a peek behind the curtain reveals an eyebrow-raising narrative.
Of the 6 percent year-to-date gain in the S&P 500, a total of 5 stocks (Apple, Microsoft, Amazon, Facebook and Google) are responsible for 11 percentage points. In other words, lumped together, the other 495 companies in the index are negative for the year! And given that the S&P 500 is size-weighted, these five popular, mega-cap stocks now control more than 25 percent of the dollars in the index even though their head count is a mere 1 percent of the constituents.
Lofty P/E ratios, in combination with a highly concentrated, tech-laden, top-heavy index, can produce volatility (risk) that can feel like we’ve got a tiger by the tail. Passive investors, with an eye only for the popular S&P 500 stock index should consider themselves warned.
Time to Get Small(er) and Cheaper?
Most of us know, either empirically or intuitively, that over long periods of time stocks have outperformed bonds. But did you know that research by Roger Ibbotson of the Yale School of Management and founder of Ibbotson Associates (now a Morningstar Company) unambiguously concludes that, over time, the stocks of smaller companies have outperformed those of larger companies and inexpensive stocks (value) have outperformed more expensive stocks (growth)? Of course, the hard part of Ibbotson’s research findings is the “over time” part. Trends can persist (like today’s infatuation for large cap, tech, growth) that plant seeds of doubt, ultimately testing the faith of even the most disciplined investor.
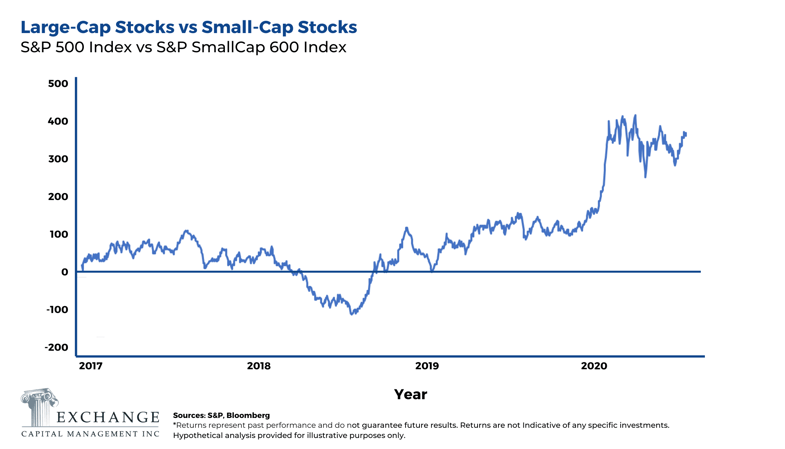
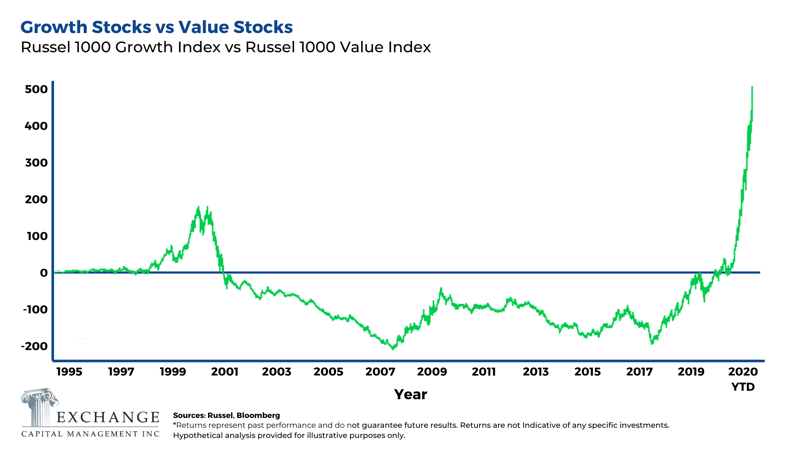
To visualize today's single-minded obsession with large cap growth, Chart 1 compares the relative price performance of the S&P 500 Index to the S&P SmallCap 600 Index while Chart 2 plots the differential between Russell 1000 Growth Index and the Russell 1000 Value Index.

 Clearly, large-cap stocks have been outperforming small-cap stocks since 2016, and growth stocks have been outperforming value stocks since 2007. While it’s human behavior to stick with what’s working (especially during a time of high anxiety), of greater concern is the way in which both of these measures have gone parabolic in 2020, a signal that a trend is much closer to its end than its beginning.
Perspective is Priceless
During times of great uncertainty, it’s easy to become myopic, discard lessons we’ve learned from the past, and just go with the headlines. In 2020, this myopia may be manifesting itself in the form of frenzied buying of big-name growth stocks because we ‘know them’. After all, we use our iPhone to answer a call from the Amazon driver who’s using Google Maps to deliver a product we purchased using our Microsoft Surface. But as easy as it is to hope that 'this time is different', we don't pin our clients' goals to one tree growing to the sky - and advise others not to presume this either.

Kevin McVeigh, CFA is a Managing Director and Partner at Exchange Capital Management, a fee-only, fiduciary financial planning firm. The opinions expressed in this article are his own.
Comments
Market Knowledge
Read the Blog
Gather insight from some of the industry's top thought leaders on Exchange Capital's team.
Exchange Capital Management, Inc.
110 Miller Ave. First Floor
Ann Arbor, MI 48104
(734) 761-6500
info@exchangecapital.com


%2c%20Will%20You%20be%20left%20Without%20a%20Chair_%20-%20Shaky%20(Color)%20-%20PNG%20-%209-14-2020.png?width=1600&name=Image%20-%20Blog%20Image%20-%20Kevin%20-%20When%20the%20Music%20Stops%20(and%20it%20will)%2c%20Will%20You%20be%20left%20Without%20a%20Chair_%20-%20Shaky%20(Color)%20-%20PNG%20-%209-14-2020.png)